Call Forecasting 8 - Intra-Day Profile Tables
Author: CCa2z
Date: 4th March 2013
Creating Profile Tables
Having established the daily call volume, this can be tabulated to represent the daily percentage.
You will then be looking to create the intra-day profile - whilst it is shown as hourly intervals below, you should be looking to develop a 30 minute profile.
You can look to do this a number of ways;
- Using an existing profile for a similar product or service
- Collecting historical data if available
- Commence making volume assumptions, which can be refined with actual data when available
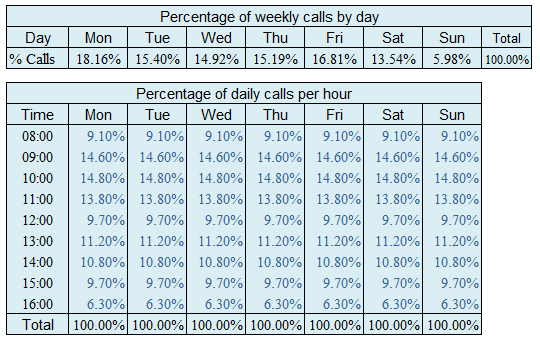
Having now established that 18.16% of the week's calls arrive on a Monday, we see form our intra-day data that 9.10% of Monday's total arrive in the first hour, peaking at 10:00 hrs with 14.80%. We can then make an assumption that each of the following days calls will follow the same profile. For Tuesday we will, therefore, assume that 9.10% of the days total will arrive in the first hour.
Whilst the profile remains the same the volume will differ as only 15.40% of the week's calls arrive on a Tuesday compared with 18.16% on a Monday.
Whilst the weekend profile remains the same, you will need to consider the following;
- Is the working window shorter - opening later/closing earlier? If so, adjust accordingly
- How will the actual profile be dictated by consumer weekend behaviour?
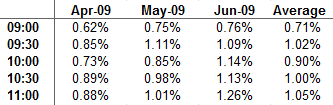
Once good historic averages and trends become available, you should work with actual data. The table below, shows good averages as it reflects for a Monday, the averages for each intra-day time segment for April, May and June together with an overall average. You should endeavour to develop a rolling year of data.
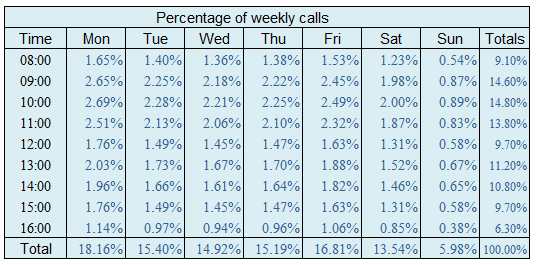
The table below, instead of showing the intra-day percentage of daily calls, shows the intra-day percentage of weekly calls. So at the 08:00 hrs segment, 9.10% of the Monday's calls arrive, which is also 1.65% of the week's calls.
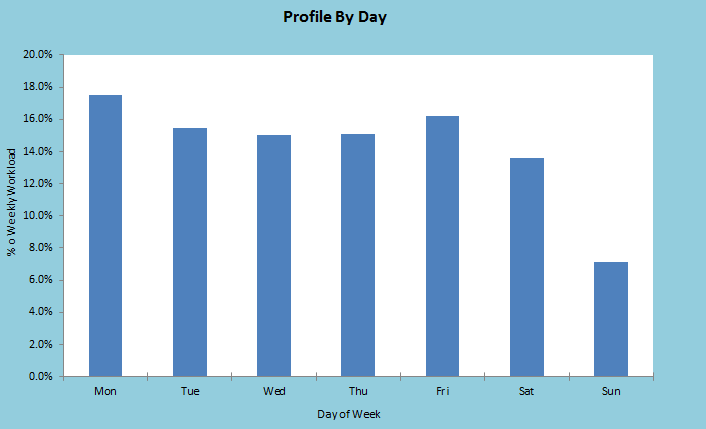
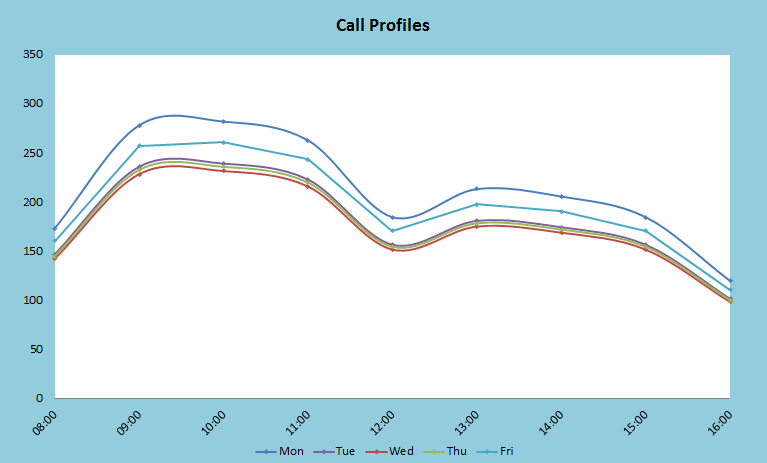
The profile by day is chartered below.
Call Profile
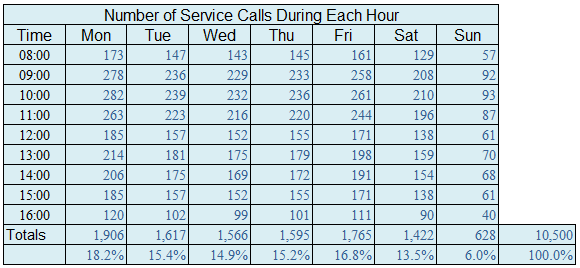
If we have an assumption for 10,500 calls per week, we can apply our assumed percentages to identify the call volume by intra-day time segment for each day of the week.
If Monday represents 18.2% of the week's calls, then we can expect 1,906 calls on a Monday from the week's total of 10,500.
If 9.10% of calls are assumed at the 08:00 hrs segment, then we can expect 173 calls from the day's total of 1,906.
The graph below, charts the daily call profile at intra-day level for each day of the week.
Call Forecasting 7 - Forecasting with Percentages
Call Forecasting 9 - Establishing Workload and Handling Times