Call Forecasting 4 - Daily Profile
Author: CCa2z
Date: 27th February 2013
Daily Calls
The next volume level and the key to real-time management is managing the daily call-flow. It is, therefore, necessary to understand and collect daily volumes, particularly as resourcing schedules will be issued monthly with the daily call-flow in mind.
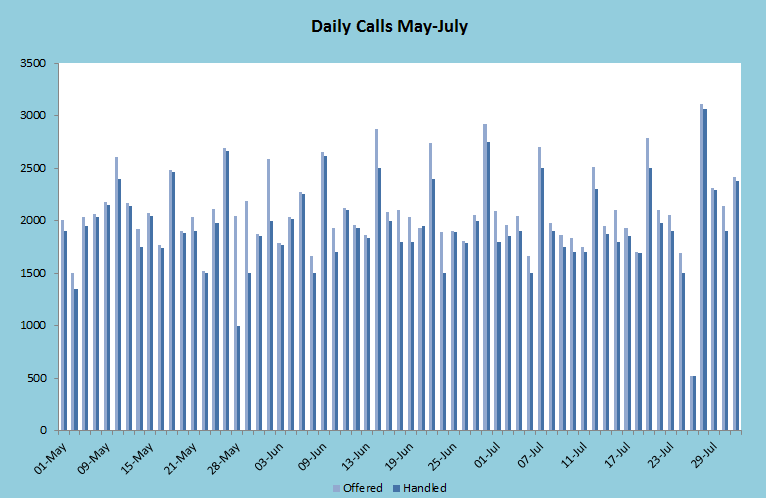
The line-graph, below, represents daily calls over a 3-month period May to June. This clearly shows the daily peaks and troughs with Mondays, peaking the highest.
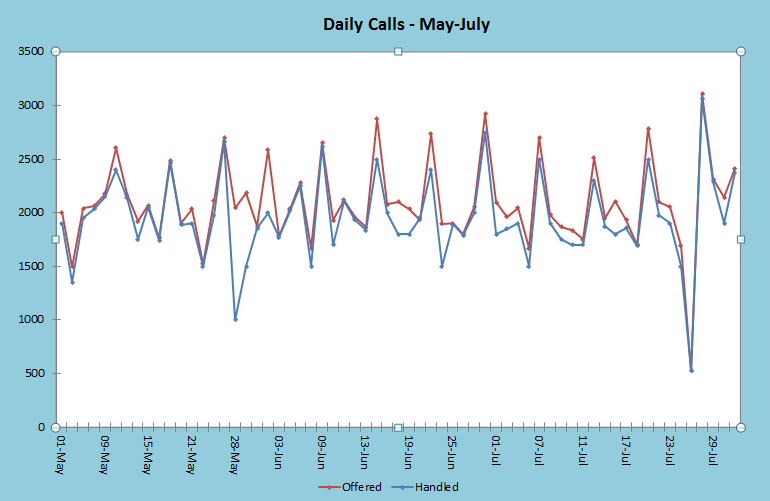
Again, it is a preference to choose a line-graph or bar chart.
As we drill down to day level, it is necessary to understand averages and trends by day. Averages can be taken over a year, half-yearly, quarterly etc. Seasonal trends need to be understood, such as, more sales orders at Christmas etc.
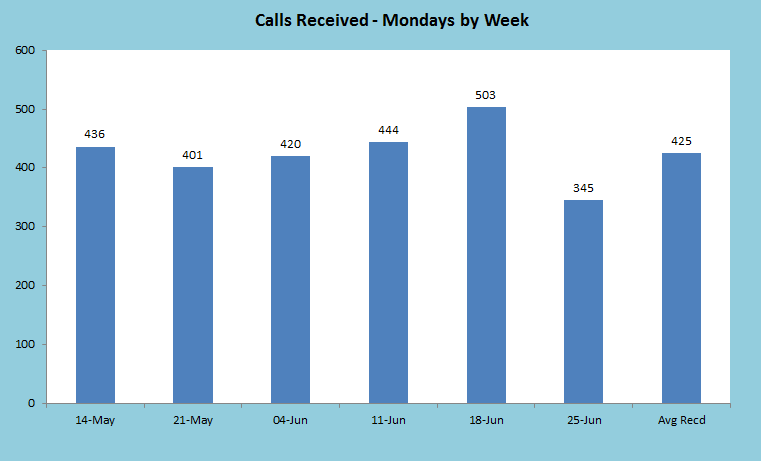
Below, the bar chart displays the total number of calls for the current and previous five Mondays, together with a six-week average. The Average for the review period will be a good indication of what to expect next Monday, given all things remaining equal.
As with all volumes it will be necessary to take account of the reasons for the high and low range and ensure there are no extenuating circumstances delivering the lower volume. If there is, then the low volume can be excluded from the average otherwise this will give a false average for resourcing. Often, somewhere in the data collection period the ACD/MIS may be down, which doesn’t then allow for correct volumes to be recorded. In these cases manual adjustments and comments should be added.
Call Forecasting 3 - Weekly Profile
Call Forecasting 5 - Intra-Day Profile